
Last updated 5 October 2026 by Kat Kavanagh
We have designed this data platform to help groups collect and manage their community's water quality data, and provide basic visualization. However, we know that to tell the full story of the data, you'll need to be able to access data in its raw format. For most people, being able to download the data from each dataset is sufficient. You'll see this link on each dataset.
For more advanced partners and organizations, Water Rangers' API can be used to pull data for visualization and to combine with other data sources. It's also a way to automatically share data in larger datasets (for example, suitable Canadian groups will have their data automatically shared with DataStream and in the UK through CaSTCo).
We limit API access so the platform stays responsive for everyone using it. We are a small non-profit and this runs on infrastructure we pay for, so if you plan to use the API regularly, please consider supporting our server costs.
Good to know
- Organizations can have multiple datasets, each with their own parameters and metadata
- Each element (organization, dataset, location, observation, reading) has its own unique reference (a UUID) that will not change
- Data downloads from the website are
.csvfiles aimed to mimic DataStream's WQX data structure - The API uses
.json - Within the API, observations have a 'last updated on' field (
updated_at) so queries can check if edits have been made. - Each observation includes QA fields via API:
checked(status),qa_notes(automatic checks), andqa_admin_noteswith author/timestamp context when provided. - Common QA statuses you may see in
checked:raw,reviewed,qc_complete, andissue_found
Data structure
Water Rangers' platform is built to provide enough structure to provide good quality meta data and high data quality for each dataset, but also the flexibility for each group to define their customized protocol. While we encourage people to use Water Rangers' testkit protocols, groups are free to use the tools to define their own.

Organization
An Organization represents the owner of one or many Datasets. Organizations can have multiple Datasets, users, and admin users. Organizations do not have to be formal. A single person looking to collect data could create their own. We encourage communities to work together as it's more sustainable and trustworthy.
Organization data: Organization name*, short description, long description, primary country, state/province/county, nearest city, email, phone, website, logo, region, datasets, users, and admin users.
Dataset
A Dataset is data collected using a specific protocol for a specific purpose and is defined by a region. You should specify things like testing equipment, protocols, frequency, data standards, region of interest, etc. Users can be part of multiple Datasets, but will have to set their primary dataset in order to contribute to that dataset.
Dataset data: Dataset name*, description, start date, intended audience, intended data use (choice), dataset purpose (choice), monitoring frequency (choice), frequency details, standards guidelines, customizable form, region of interest, share with DataStream (see data sharing below), users and admin users.
Form parameters
Each dataset has their own customizable form where they can specify what parameter they're testing and with what type of equipment, and if they're testing one, two, or three times. You can rearrange the form to correspond to your protocol testing order. The equipment choices are based on commonly used community science parameters so that we can provide detection ranges. There are opportunities to import existing protocols from Water Rangers and some of our partners. Getting the form right sets your volunteers up for successful monitoring and produces much higher quality data.
Fields like sample ID, testers, weather, ice-on, and preset qualitative protocols are available. These tend to be less customizable. See Observation form for more on how the form is put together.
Location
Locations are exclusive to an individual Dataset and display information for a particular Dataset only. You can set up testing Locations in the same spot, matching latitude and longitude, however, Datasets will not be combined into a single location summary. Location summaries show trends over time, as well as lines to show when Readings are above recommended levels based on region.
Location data: latitude*, longitude*, country (reverse geo-coded), state/province/county (reverse geo-coded), time-zone (auto), waterbody name*, location name*, location ID, waterbody type*, land uses, bank vegetation, reference photo (available as a signed URL via the API), and assigned data collector.
Observation
Observations are groupings of Readings on a particular day. Many people take multiple Readings at the same time.
Readings or Datapoints
Readings are how we describe individual parameter results including their unit and equipment. We use the term Datapoints on our interface to count Readings.
Readings data: Associated with one location, dataset, organization and user. Each reading is also locked to a parameter's contextual data that was set up by the dataset administrator. This includes method and equipment (which is locked to specific units and ranges). Readings can be either quantitative (e.g. a number value, such as a conductivity reading of 164 uS/cm) or qualitative (e.g. a word descriptor, such as a water colour is green and yellow). Qualitative readings can provide a single choice (radio), select multiple (checkbox), or provide free form (text field). We are working hard to offer flexibility to accomodate complex Readings that are common to community science (e.g. secchi depth can be quantiative as 1.3m or qualitative as 'bottom visible').
Notes and photos
Often times notes and photos provide extra context. Right now you can add multiple photos by control clicking within your file browser only. Observation photos are also available as signed URLs via the API.
Points of interest
Points of interest are owned by an organization/dataset and display upstream (before) and downstream (after) a specific point that is, well, of interest. This can be a pollution source where you want to collect long-term trends or an intervention like reed planting, intending to show the intervention's effect on water quality. We recommend organizations set up dedicated datasets for tracking points of interest. This feature is under development: if you'd like to add in points of interest, please contact us.
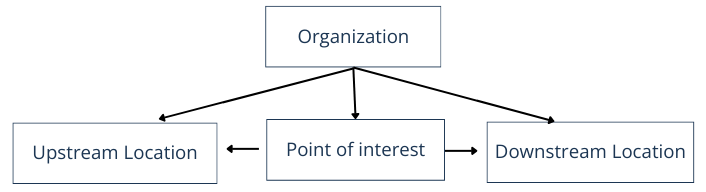
Points of interest data: Latitude, Longitude, Owner organization, Downstream location ID, Upstream location ID, Grid Ref, Point of interest name, Receiving water course, created at, updated at, Point of interest category (shoreline restoration, wetland, outflow, altered shoreline, pollution source, algal bloom, other), description.
Downloading data and data usage
Organizations own their data. Water Rangers provide this platform as a place for communities to share it and datasets are open by default.
You can download a dataset without a login by visiting the dataset page and clicking on "Download data" on the left side panel. You will need to fill out a form to help us understand data usage. Once you fill out the form, buttons will appear for downloading the dataset's metadata and data (as two separate buttons). Data is provided in a format (almost the same as that) of DataStream's WQX data standard.
Datasets are made downloadable by Water Rangers under the Open Data Commons Attribution Licence (ODC-By). You are free to share, modify, and use this dataset, provided that proper attribution is given. The proper attribution statement is provided to you when you download data from a dataset. It follows this format:
SOURCE: [Dataset name] dataset by [Organization] is licensed under Open Data Commons Attribution Licence (ODC-By).
As a data user, it is important for you to recognize the efforts and intentions of each dataset.
Importing historical data to this platform
If you have historical data you'd like to import, you can do it yourself with our import tool. It builds a template from your dataset's own form, so the columns line up with the parameters you actually collect, and it validates the file before you submit it. See Importing historical data for the full process. More involved migrations still take time from technical staff to map your metadata and check it imports correctly. We charge a small fee to recognize this effort (we apply for grant funding to provide this service, especially for priority groups that are historically underfunded. If your organization needs financial support, please let us know).
Request to use our API
- Sign up for an account. You do not need to go through the process of creating or joining an organization.
- Send an email to contact [at] waterrangers [dot] ca with the email you registered with, a little bit about you, plus a description of what data you're looking to pull and how often you plan to use the API connection.
- If your implementation fits, we will send you an API key to your email. This may take a few days, so please give yourself adequate time to make this request.
- Your rate limit will initially be set at 1000.
Using the API
Using APIs requires coding skills. If you are new to this, please consider downloading individual datasets as a .csv from the dataset pages.
Appending .json to your endpoint and then including the API key to the end of your URL. For example, to access datasets, you'd visit:
https://data.waterrangers.com/datasets.json?api_key=[api_key]
Read the API endpoints documentation for authentication, rate limits, errors, the available endpoints and what each response contains.
If you are building workflows around data quality, the observations endpoint includes QA-specific metadata. You can use checked for the QA status, qa_notes for automated QA notes, and qa_admin_notes (plus author/timestamp fields) for admin review context.
Webhooks
If you are polling the API on a schedule to spot new records, a webhook is usually a better fit. We can post to your endpoint when an observation, location or dataset changes, filtered to the parameters, datasets, countries or area you care about. See the webhooks guide.