This dataset is inactive (last observation on 28 March 2021).
Dataset
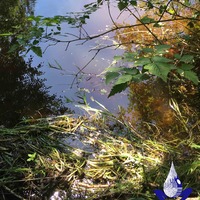
Salt Spring Island FreshWater Catalogue (SSIFWC) Project
Dataset summary
Observations
3 parameters tested ▾
conductivity, ph, water temperature
2112 S Canyon Ck 200m U/S from outfall
4 parameters tested ▾
air temperature, conductivity, ph, water temperature
2112 W Ribbon Ck, 20m U/S from falls into Canyon Ck
4 parameters tested ▾
air temperature, conductivity, ph, water temperature
WSCK Weston Lake Creek inflow E1
4 parameters tested ▾
air temperature, conductivity, ph, water temperature
4 parameters tested ▾
air temperature, conductivity, ph, water temperature
XWQW Site 2W Welcome Pole Ck CMP
3 parameters tested ▾
conductivity, ph, water temperature
2017 Madro Creek Upper Ganges Culvert
4 parameters tested ▾
air temperature, conductivity, ph, water temperature
SLCK Soule Creek aka Fulford creek spur
3 parameters tested ▾
conductivity, ph, water temperature
3 parameters tested ▾
conductivity, ph, water temperature
FNCK FernCreek culvert outfall
3 parameters tested ▾
conductivity, ph, water temperature
3 parameters tested ▾
conductivity, ph, water temperature
LLCK Larlow creek outfall aka Grants Corner creek
3 parameters tested ▾
conductivity, ph, water temperature
4 parameters tested ▾
air temperature, conductivity, ph, water temperature
WSCK Weston Lake Creek inflow E1
4 parameters tested ▾
air temperature, conductivity, ph, water temperature
2017 Madro Creek Upper Ganges Culvert
4 parameters tested ▾
air temperature, conductivity, ph, water temperature
2112 S Canyon Ck U/S Ribbon Falls
4 parameters tested ▾
air temperature, conductivity, ph, water temperature
2112 S Canyon Ck 200m U/S from outfall
4 parameters tested ▾
air temperature, conductivity, ph, water temperature